Brian Gaze
09 December 2015 17:01:17

Originally Posted by: Retron 


Put it another way - a week ago some noteable warming at 1hPa started to be shown on the GFS charts at 384. It's still there at 216 on today's chart and it's been there every run (4 a day) for the past week.


http://www.instantweathermaps.com/GFS-php/showmap-strat.php?run=2015120912&var=TMP&lev=1mb&hour=216


In the meantime, the operational at both 500 and 1000 has shown all manner of outcomes at the same timescale.


It's been my experience that strat forecasting is actually pretty darned good... but our understanding of exactly what effects it'll have lower down still needs working on!


But as you know that's anecdotal. Not necessarily a bad approach at times but the NCEP stats don't seem to back it up. I'd also say that when looking at 500hPa charts across the entire hemisphere they don't jump around nearly as much as many people think. The jumping around is to a large extent a function of zooming in and focusing on the UK / NW Europe as we often do at this level.


Brian Gaze
Berkhamsted
TWO Buzz - get the latest news and views 
"I'm not socialist, I know that. I don't believe in sharing my money." - Gary Numan
David M Porter
09 December 2015 17:08:19

GFS 12z seems to be very slow in appearing on WZ, normally it has fully updated by about 5pm.


Lenzie, Glasgow

"Let us not take ourselves too seriously. None of us has a monopoly on wisdom, and we must always be ready to listen and respect other points of view."- Queen Elizabeth II 1926-2022
Solar Cycles
09 December 2015 17:12:28

Originally Posted by: Retron 


Put it another way - a week ago some noteable warming at 1hPa started to be shown on the GFS charts at 384. It's still there at 216 on today's chart and it's been there every run (4 a day) for the past week.


http://www.instantweathermaps.com/GFS-php/showmap-strat.php?run=2015120912&var=TMP&lev=1mb&hour=216


In the meantime, the operational at both 500 and 1000 has shown all manner of outcomes at the same timescale.


It's been my experience that strat forecasting is actually pretty darned good... but our understanding of exactly what effects it'll have lower down still needs working on!


Indeed it is and we need this to transpire in the reliable timeframe  before we dust our sledges off. However the fact that it remains is a positive to take forward and also the fact that the model outlook in FI has been all over the place whilst trying to resolve the upstream pattern is something to keep us all interested, for now.

moomin75
09 December 2015 17:14:42
12z has indeed been slow in updating but it's now trickling through and once again is not good viewing at all. I would say all the models are firming up now on a prolonged mild and worryingly wet period, starting to resemble the dreadful winter of 2013/14 dare I say.
Witney, Oxfordshire
100m ASL
David M Porter
09 December 2015 17:24:34

Originally Posted by: moomin75 

12z has indeed been slow in updating but it's now trickling through and once again is not good viewing at all. I would say all the models are firming up now on a prolonged mild and worryingly wet period, starting to resemble the dreadful winter of 2013/14 dare I say.


The main difference between the current wet spell and the events of 2013/14 is that this spell has been ongoing since the early days of November. That's five weeks by my reckoning. In 2013 the zonality that dominated that winter didn't commence until the middle weekend of December and then lasted all the way through until mid-February 2014 or just after that. That was a truly exceptional winter though, in terms of the sheer persistence of the zonal pattern we had.


Back on topic: I wouldn't go as far as saying the models are firming up on anything just now. Until developments for early next week are properly sorted out one way or another, then I don't think anything can be firmly ruled in or out as far as what comes along afterwards is concerned. I would suggest that FI starts between 96hrs and 144 hrs ahead at the moment.


Lenzie, Glasgow

"Let us not take ourselves too seriously. None of us has a monopoly on wisdom, and we must always be ready to listen and respect other points of view."- Queen Elizabeth II 1926-2022
The Beast from the East
09 December 2015 17:30:43

Doesnt look like the Euroslug has any desires to shift. (and she's just been made Time Magazine's Person of the Year!)


"We have some alternative facts for you"
Kelly-Ann Conway - special adviser to the President
Stormchaser
09 December 2015 17:33:29

Originally Posted by: Brian Gaze 


But as you know that's anecdotal. Not necessarily a bad approach at times but the NCEP stats don't seem to back it up. I'd also say that when looking at 500hPa charts across the entire hemisphere they don't jump around nearly as much as many people think. The jumping around is to a large extent a function of zooming in and focusing on the UK / NW Europe as we often do at this level.


Models like GFS are good at showing us if warming of the strat. and displacement of the vortex are likely, but bad at getting the timing right (often too progressive) and also the movement of the vortex beyond a very broad suggestion e.g. toward Asia in general.


So it is that verification stats hardly impress - however reading an overall signal from the strat. charts tends to be fairly reliable, particularly if an adjustment to expectations is made based on known errors, such as anticipating a possible significant warming event toward the end of the month based on the current hints from GFS for the mid-month period.


...


Moving on to today's output, and the GFS 12z is dire for much of Wales and the central third of England, with a frontal system becoming trapped across the UK while a developed low advances very slowly from the southwest and - most significantly - a number of secondary disturbances develop and run west-east along that frontal boundary.


Modele GFS - Carte prévisions


The result is 3 days of persistent, often heavy rain, with over 100 mm projected for many locations within the band outlined above.


across a wide area (even when taking out the pre-weekend totals).


The second disturbance is arguably the worst and it just so happens there's little sign of that in the UKMO output this evening so there's a cause for some hope that the rains might not prove as bad as GFS is suggesting.


For what it's worth, here's the 10-day total:


No chart available for the selected hour. Many charts start at 3 hours ahead, so if you have 0 hours selected try stepping forward or selecting a later hour. 


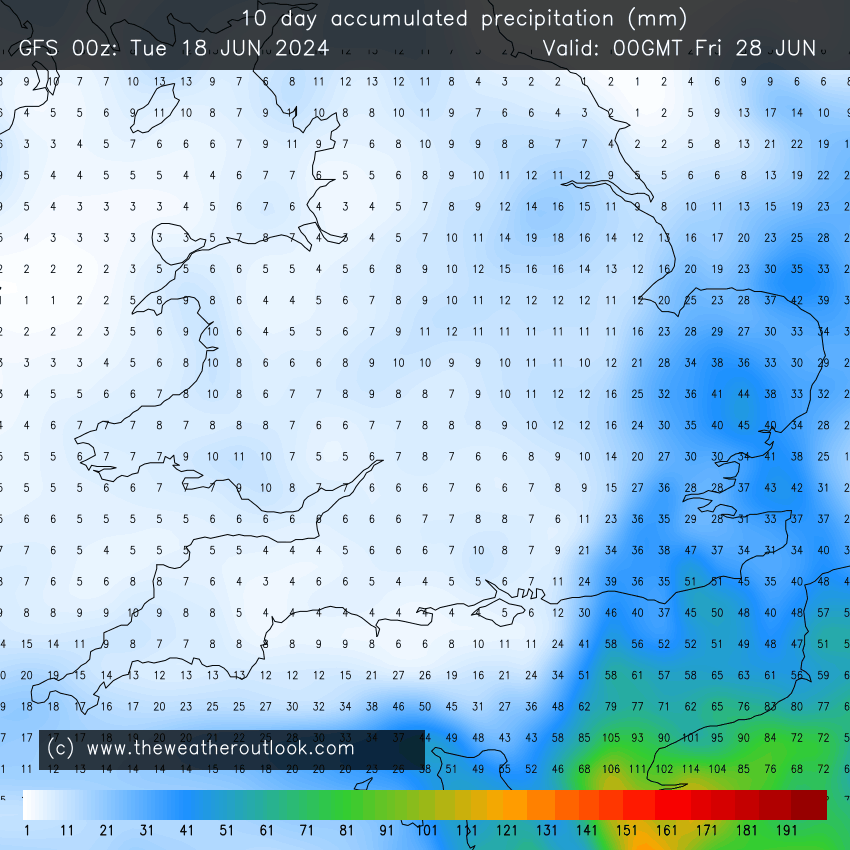
Imagine where the monthly totals would stand across NW Wales by that time if this run was to prove accurate! 


If you have any problems or queries relating to TWO you can Email [email protected] 🙂
https://twitter.com/peacockreports 
2021's Homeland Extremes:
T-Max: 30.4°C 21st Jul | T-Min: -6.8°C New Years Day! | Wettest Day: 34.1mm 2nd Oct | Ice Days: 2 (27th Jan & 8th Feb)
Keep Calm and Forecast On
Maunder Minimum
09 December 2015 17:35:17

Originally Posted by: moomin75 

12z has indeed been slow in updating but it's now trickling through and once again is not good viewing at all. I would say all the models are firming up now on a prolonged mild and worryingly wet period, starting to resemble the dreadful winter of 2013/14 dare I say.


A repeat of 2013/14 and I am going to seriously consider emigrating!


Damn that Euroslug, it really spoils the party.


New world order coming.
moomin75
09 December 2015 17:40:00

Originally Posted by: Maunder Minimum 


A repeat of 2013/14 and I am going to seriously consider emigrating!


Damn that Euroslug, it really spoils the party.


Tis why I'm off to Australia in 3 weeks time with a view to making it something more permanent. I've had enough of this country and the vile climate.


Witney, Oxfordshire
100m ASL
Weathermac
09 December 2015 17:47:46

Originally Posted by: moomin75 


Tis why I'm off to Australia in 3 weeks time with a view to making it something more permanent. I've had enough of this country and the vile climate.


Winter starts in 3 weeks time then tongue-out


must admit I really do hate seeing that Euroslug every time I view the latest output ...please sod off Asap yell

moomin75
09 December 2015 17:52:49

It will sod off in time for summer don't you worry!


Witney, Oxfordshire
100m ASL
Weathermac
09 December 2015 18:15:28

Originally Posted by: moomin75 


It will sod off in time for summer don't you worry!


yes it's ironic that whilst most of Europe baked last summer it never got going here except for 1 day at start of July when we couldn't get high pressure near our shores cool


LA2B MeridFlowEuro09
09 December 2015 18:18:52

The GFS and UKMO based UK weather forecast has Cold air for Scotland N and NE Irland and North England on Sunday to Tuesday, High Pressure over ENE side area UK, is High on Sunday with quiet weather, but SW and South winds some SE flow winds or even SW flow on Monday and Tuesday Next Week, brings areas of heavy rain in some places in fact.


😆🙂


Climate is warming up, Scotland and N Ireland and North England still often gets some Winter frost, ice and snow, November to March, but the SE and South UK including S Central England and Wales, together with the West and North through the year, they sometimes get more rain than London and S SE England, where some longer dry fine spells without much heavy rain is seen every year.

The North Atlantic Sea often gets some much Colder Wintry conditions from November to March Months, and Mild SW and South winds tend to be more frequent over the East and SE of North Atlantic Sea, as the Azores High tends to stay in charge. 

With this warmth and heat, the Central and South UK has become mostly free of snow and frost.
Brian Gaze
09 December 2015 18:22:06

Originally Posted by: Stormchaser 


Models like GFS are good at showing us if warming of the strat. and displacement of the vortex are likely, but bad at getting the timing right (often too progressive) and also the movement of the vortex beyond a very broad suggestion e.g. toward Asia in general.


So it is that verification stats hardly impress - however reading an overall signal from the strat. charts tends to be fairly reliable, particularly if an adjustment to expectations is made based on known errors, such as anticipating a possible significant warming event toward the end of the month based on the current hints from GFS for the mid-month period.


 Thanks, that makes sense and fits in with Retron's point about the top level warming he has been tracking. 


PS: Your link to TWO GFS accumulated rainfall has updated to the 12z version now I noticed.


Brian Gaze
Berkhamsted
TWO Buzz - get the latest news and views 
"I'm not socialist, I know that. I don't believe in sharing my money." - Gary Numan
Brian Gaze
09 December 2015 18:27:59

The Xmas day GEFS12z postage stamps are pretty interesting and worth watching in the coming days:


PS: Click through for almost full sized version


Brian Gaze
Berkhamsted
TWO Buzz - get the latest news and views 
"I'm not socialist, I know that. I don't believe in sharing my money." - Gary Numan
TimS
  • TimS
  • Advanced Member
09 December 2015 18:39:57
Number 10 is impressive, as is number 12. 19 is weird.

If it's going to be mild it might as well be record breakingly mild. The 12z operational, if it came to fruition, would almost certainly give us a record December given the positioning of the depressions in the Atlantic at 384hrs, getting ready to flood yet more mild air over the country.
Brockley, South East London 30m asl
Gooner
09 December 2015 18:53:18

Originally Posted by: TimS 

Number 10 is impressive, as is number 12. 19 is weird.

If it's going to be mild it might as well be record breakingly mild. The 12z operational, if it came to fruition, would almost certainly give us a record December given the positioning of the depressions in the Atlantic at 384hrs, getting ready to flood yet more mild air over the country.


why?


Remember anything after T120 is really Just For Fun


Marcus
Banbury
North Oxfordshire
378 feet A S L


Ally Pally Snowman
09 December 2015 19:15:14

Originally Posted by: TimS 

Number 10 is impressive, as is number 12. 19 is weird.

If it's going to be mild it might as well be record breakingly mild. The 12z operational, if it came to fruition, would almost certainly give us a record December given the positioning of the depressions in the Atlantic at 384hrs, getting ready to flood yet more mild air over the country.


You might well get your wish with charts like this! That's about as crap as you can possibly get for coldies.


http://www.wetterzentrale.de/pics/Recm2401.html


Bishop's Stortford 85m ASL.
Brian Gaze
09 December 2015 19:15:18

Here's an interesting graphic from NCEP which supports the trend towards higher pressure over Europe in the winter months.


Brian Gaze
Berkhamsted
TWO Buzz - get the latest news and views 
"I'm not socialist, I know that. I don't believe in sharing my money." - Gary Numan
RobN
  • RobN
  • Advanced Member
09 December 2015 19:19:36

Originally Posted by: Gooner 


why?


I guess, to relieve the unbearable tedium of it being merely very mild.


Rob
In the flatlands of South Cambridgeshire 15m ASL.
Users browsing this topic

Ads