Remove ads from site

Caz
  • Caz
  • Advanced Member
29 December 2014 15:22:05

Thanks GW.  I congratulate you on your mathematical calculations but I can tell Dev that there is absolutely no skill involved in my predictions.  Mine are pure guesses!  But that's probably obvious given my table position! 


Market Warsop, North Nottinghamshire.
Join the fun and banter of the monthly CET competition.
ARTzeman
29 December 2014 15:55:55

My name is on the list which is good enough for me . Wherever  I may be....


Some people walk in the rain.
Others just get wet.
I Just Blow my horn or trumpet
Devonian
29 December 2014 20:40:08


Thanks GW.  I congratulate you on your mathematical calculations but I can tell Dev that there is absolutely no skill involved in my predictions.  Mine are pure guesses!  But that's probably obvious given my table position! 


Originally Posted by: Caz 


Yup, thanks GW.


I'm not sure there is any skill either but I think there are (or may be) strategies, a little climatology and tendencies that can keep errors under control. But, whether the comp has been running long enough to show that I'm not sure.

ARTzeman
30 December 2014 12:39:38

Met Office Hadley      5.6c.    Anomaly     0.9c.   Provisional to 29th.


met check                 5.36c.  Anomaly     0.37c.


N-W                          5.83c.  Anomaly    0.74c.


Mount Sorrel               5.48c.  Anomaly    0.38c.


My  Mean                    5.4c.    Anomaly    -1.1c.


Some people walk in the rain.
Others just get wet.
I Just Blow my horn or trumpet
Saint Snow
30 December 2014 13:06:43


Worth noting that up to now the smallest annual prediction error in the competition was the 7.7C recorded by Saint Snow in 2009. This year at least the top 5 in the competition will all better this figure just highlighting further how good the predictions have been.


Originally Posted by: Global Warming 


Oh no! My record's going to fall?


Martin
Home: St Helens (26m asl) Work: Manchester (75m asl)
A TWO addict since 14/12/01
"How can wealth persuade poverty to use its political freedom to keep wealth in power? Here lies the whole art of Conservative politics."
Aneurin Bevan
wallaw
31 December 2014 06:43:49
I definitely think we should use the method above for the comp, definitely😀
Ian


Stockton-on-Tees

Surrey John
31 December 2014 08:56:05

I predicted December badly wrong, will crash down the final table.

Under RMSD I will be killed, with 3 bad guesses 

Oh dear, always another year to try again


Bradford on Avon, Wiltshire
35m ASL
ARTzeman
31 December 2014 10:14:37

Will be on the bottom or very near.... Usual  place....


Some people walk in the rain.
Others just get wet.
I Just Blow my horn or trumpet
lanky
31 December 2014 12:05:37


The second column shows the cumulative prediction errors of the top 10 people in the final competition table. If we divide this by 10 it gives an average prediction error. In 2012 the average error is quite small but this is to be expected given the temperatures were generally close to the mean and typically in the competition most people tend to make predictions that are not too far from the mean. In 2010 and 2011 when temperatures deviated more markedly from the mean the prediction errors tended to be higher as a result.


In 2013 the CET deviations from the mean were between the low value recorded in 2012 and the much higher values in 2010 and 2011. However, the average prediction errors in 2013 were the highest recorded in the 6 years I have been running this competition. This suggests the skill level of the predictions in 2013 was really quite low across the board.


Conversely in 2014 the CET deviations from the mean were very high and only just below those in 2011. Yet the prediction errors in the competition this year have easily been the lowest I have ever seen. This suggests predictive skill this year has been very high indeed.


Looking at the final column of the table we see the number of months in each year where the CET mean deviated by more than 1C from the 1971-2000 mean. 2014 has the highest number by far of any year and yet still has the lowest prediction errors. Now of course 2014 has been consistently very warm throughout (August excepted) and hence this may have helped because we have not shifted from warm to cold or vice versa very much. But even so given the significant CET anomalies I think it is quite remarkable how well the CET has been predicted this year. It will be a tough job to improve on these figures in 2015.


Worth noting that up to now the smallest annual prediction error in the competition was the 7.7C recorded by Saint Snow in 2009. This year at least the top 5 in the competition will all better this figure just highlighting further how good the predictions have been.


Originally Posted by: Global Warming 


I think there is another way of looking at this set of data, though


I'm not convinced that the "skill level" has changed drastically between 2013's rubbish skill and 2014's. budding meteorologists.


2014 happened to be a year with a very high cumulative anomaly but importantly almost all in the same direction. So (at least in my case) the only skill was thinking that this was a longish term trend and going highish every month - which has worked like a charm this year


A better way of assessing skill would be to match the average error against the STANDARD DEVIATION of the monthly anomalies (this is a measure of the degree of scatter pf the anomalies  from the best fit line). 2014 with 10 or 11 anomalies in the same direction has a high cumulative value but a low standard deviation. (This also handles adding + and - figures together OK)


If you look at that way of doing it, you find a reasonable fit between the average error and the standard deviation of the anomaly - and much better than the fit between error and cumulative anomaly. The table below shows the correlation coefficient (how good a fit there is, 0=no fit and 1=perfect fit) between these two measures


Incidentally if 2010 is removed to get rid of the horrendous errors from Dec 2010 (CET anomaly of -5.8C vs 1971-2000) then the correlation coefficient of the STDEV goes up to 0.94
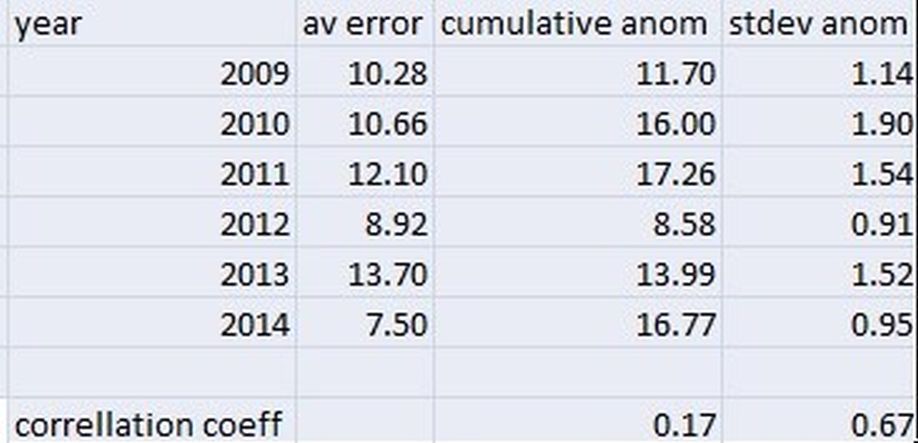


So as a rule of thumb,  2012 and 2014 have been quite easy years and 2010, 2011 and 2013 difficult based on Standard Deviation of anomaly and they have higher error rates


Martin
Richmond, Surrey
ARTzeman
31 December 2014 12:10:07

Last one for the month and year.


Met Office Hadley.         5.5c.      Anomaly      0.8c.     Provisional to   30th.


Metcheck                       5.24c.    Anomaly      0.25c.


N-W                               5.66c     Anomaly      0.57c.


Mount    Sorrel                 5.38c.     Anomaly     0.28c


 My    Mean                       5.3c.       Anomaly     -1.2c.


Some people walk in the rain.
Others just get wet.
I Just Blow my horn or trumpet
Devonian
31 December 2014 19:41:47


I think there is another way of looking at this set of data, though


I'm not convinced that the "skill level" has changed drastically between 2013's rubbish skill and 2014's. budding meteorologists.


2014 happened to be a year with a very high cumulative anomaly but importantly almost all in the same direction. So (at least in my case) the only skill was thinking that this was a longish term trend and going highish every month - which has worked like a charm this year


A better way of assessing skill would be to match the average error against the STANDARD DEVIATION of the monthly anomalies (this is a measure of the degree of scatter pf the anomalies  from the best fit line). 2014 with 10 or 11 anomalies in the same direction has a high cumulative value but a low standard deviation. (This also handles adding + and - figures together OK)


If you look at that way of doing it, you find a reasonable fit between the average error and the standard deviation of the anomaly - and much better than the fit between error and cumulative anomaly. The table below shows the correlation coefficient (how good a fit there is, 0=no fit and 1=perfect fit) between these two measures


Incidentally if 2010 is removed to get rid of the horrendous errors from Dec 2010 (CET anomaly of -5.8C vs 1971-2000) then the correlation coefficient of the STDEV goes up to 0.94


So as a rule of thumb,  2012 and 2014 have been quite easy years and 2010, 2011 and 2013 difficult based on Standard Deviation of anomaly and they have higher error rates


Originally Posted by: lanky 


Interesting, and this year I've just assumed (a reasonable assumption nonetheless) the warmth will go on, and on...Only August bucked that trend - a month few came even near getting right.


My question to GW was just that we had several years of data and there might (or might not) be something of interest to be gleaned from it. As I said I think there are clear ways to minimise errors and that thus, maybe, we'll get better at the predictions.


One other thing I find interesting is the shape of each months guesses is, without fail, a stretched 's'. Why is this? Is it 'normal distribution'? I guess it shows we do use some skill in our prediction, they aren't random but they might well not be much better than sticking with climatology (humm, how would someone have done over four years simply going for average each month - I think I asked GW that but I forget...).

Global Warming
01 January 2015 11:33:31


Interesting, and this year I've just assumed (a reasonable assumption nonetheless) the warmth will go on, and on...Only August bucked that trend - a month few came even near getting right.


My question to GW was just that we had several years of data and there might (or might not) be something of interest to be gleaned from it. As I said I think there are clear ways to minimise errors and that thus, maybe, we'll get better at the predictions.


One other thing I find interesting is the shape of each months guesses is, without fail, a stretched 's'. Why is this? Is it 'normal distribution'? I guess it shows we do use some skill in our prediction, they aren't random but they might well not be much better than sticking with climatology (humm, how would someone have done over four years simply going for average each month - I think I asked GW that but I forget...).


Originally Posted by: Devonian 


You can tell how someone would have done going with the average each month from my table above. In 2014 and also 2010 and 2011 such a tactic would have been a disaster. The cumulative errors to the long run mean being very much higher than the average error of those finishing in the top 10. Conversely in 2012 and 2013 such a tactic would have been good as the cumulative errors from the mean in those years were similar to the average error of those finishing in the top 10 of the competition.


Global Warming
01 January 2015 11:34:59

The final December CET was 5.16C. So congratulations to Dougie, Gavin823, GezM and lanky who all predicted 5.2C.


http://www.metoffice.gov.uk/hadobs/hadcet/cet_mean_2014


The final CET for the year (using daily data) was 10.95C which is a new record beating the 10.86C recorded in 2006.

Global Warming
01 January 2015 11:45:02

Here are the charts for December. An average month overall but some big swings with a cool spell from the 3rd to the 14th, very mild from the 16th to the 24th and then very cold from the 26th to the 30th.


Global Warming
01 January 2015 12:34:55

Annual CET competition - December update


Well I had just typed out a post and the site crashed so I lost the lot. Don't have time to type it again so here are tables.


Congratulations to our winner Darren S and everyone who finished in the top 10.


Dougie
01 January 2015 14:48:28

Thanks for the tables Simon, and thanks for running the competition, you do a wonderful job. It has been keenly contested throughout, so a big well done to everyone for taking part, particularly Darren who won by a bigger margin than I expected.


It's good to see some new additions for this year, so good luck to you all.


Happy New Year.


Ha'way the lads
redmoons
01 January 2015 15:02:58

Thanks for running the competition GW, surprised to have moved up to 3rd, well done to Darren.


Andrew,
Watford
ASL 35m
http://weather.andrewlalchan.co.uk 


Hungry Tiger
01 January 2015 19:44:26

Thanks for all those tables, stats and a very big thanks Simon for running this competition.


I'll leave this stickied for a few weeks so everyone can be sure they have seen their results.


Also I must say well done to all those who took part.


Gavin S. FRmetS.
TWO Moderator.
Contact the TWO team - [email protected]
South Cambridgeshire. 93 metres or 302.25 feet ASL.


cowman
01 January 2015 19:53:32
Thanks GW.
lanky
01 January 2015 20:16:56


The final December CET was 5.16C. So congratulations to Dougie, Gavin823, GezM and lanky who all predicted 5.2C.


http://www.metoffice.gov.uk/hadobs/hadcet/cet_mean_2014


The final CET for the year (using daily data) was 10.95C which is a new record beating the 10.86C recorded in 2006.


Originally Posted by: Global Warming 


Thanks GW and of course thanks for all your hard graft and stats throughout the year !


Nice to get a gold for a change and I know b*ggars can't be choosers but I'd have preferred a January gong to start off the year up the top


Martin
Richmond, Surrey
Deep Powder
01 January 2015 22:35:38
Cheers GW for all of your hard work on this great comp, much appreciated; I must do better this year!😀
Near Leatherhead 100masl (currently living in China since September 2019)
Loving the weather whatever it brings, snow, rain, wind, sun, heat, all great!
ARTzeman
01 January 2015 22:37:50

Thanks for the tables charts and everything you do. Well appreciated...


Some people walk in the rain.
Others just get wet.
I Just Blow my horn or trumpet
Darren S
01 January 2015 23:01:41
Thanks GW for organising this! I am shocked by how much I won the competition by, though can't help thinking it was because Gusty threw it away. With a different prediction he would have won.

If anyone is wondering what my technique is; well it's just guessing mixed with a bit of what the ensembles are showing for the next couple of weeks and some extrapolation. Nothing clever at all!
Darren
Crowthorne, Berks (87m asl)
South Berks Winter Snow Depth Totals:
2023/24 0 cm; 2022/23 7 cm; 2021/22 1 cm; 2020/21 13 cm; 2019/20 0 cm; 2018/19 14 cm; 2017/18 23 cm; 2016/17 0 cm; 2015/16 0.5 cm; 2014/15 3.5 cm; 2013/14 0 cm; 2012/13 22 cm; 2011/12 7 cm; 2010/11 6 cm; 2009/10 51 cm
Snow Hoper
02 January 2015 05:32:19

Thanks for all you do GW, that silly summer month prediction got me otherwise i could have been top five.


Going to war over religion is like killing each other to see who has the better imaginary friend.


Home : Thorndon, Suffolk.
wallaw
02 January 2015 07:41:03
Thanks GW and well done Darren
Ian


Stockton-on-Tees

Remove ads from site

Ads