
The second column shows the cumulative prediction errors of the top 10 people in the final competition table. If we divide this by 10 it gives an average prediction error. In 2012 the average error is quite small but this is to be expected given the temperatures were generally close to the mean and typically in the competition most people tend to make predictions that are not too far from the mean. In 2010 and 2011 when temperatures deviated more markedly from the mean the prediction errors tended to be higher as a result.
In 2013 the CET deviations from the mean were between the low value recorded in 2012 and the much higher values in 2010 and 2011. However, the average prediction errors in 2013 were the highest recorded in the 6 years I have been running this competition. This suggests the skill level of the predictions in 2013 was really quite low across the board.
Conversely in 2014 the CET deviations from the mean were very high and only just below those in 2011. Yet the prediction errors in the competition this year have easily been the lowest I have ever seen. This suggests predictive skill this year has been very high indeed.
Looking at the final column of the table we see the number of months in each year where the CET mean deviated by more than 1C from the 1971-2000 mean. 2014 has the highest number by far of any year and yet still has the lowest prediction errors. Now of course 2014 has been consistently very warm throughout (August excepted) and hence this may have helped because we have not shifted from warm to cold or vice versa very much. But even so given the significant CET anomalies I think it is quite remarkable how well the CET has been predicted this year. It will be a tough job to improve on these figures in 2015.
Worth noting that up to now the smallest annual prediction error in the competition was the 7.7C recorded by Saint Snow in 2009. This year at least the top 5 in the competition will all better this figure just highlighting further how good the predictions have been.
I think there is another way of looking at this set of data, though
I'm not convinced that the "skill level" has changed drastically between 2013's rubbish skill and 2014's. budding meteorologists.
2014 happened to be a year with a very high cumulative anomaly but importantly almost all in the same direction. So (at least in my case) the only skill was thinking that this was a longish term trend and going highish every month - which has worked like a charm this year 
A better way of assessing skill would be to match the average error against the STANDARD DEVIATION of the monthly anomalies (this is a measure of the degree of scatter pf the anomalies from the best fit line). 2014 with 10 or 11 anomalies in the same direction has a high cumulative value but a low standard deviation. (This also handles adding + and - figures together OK)
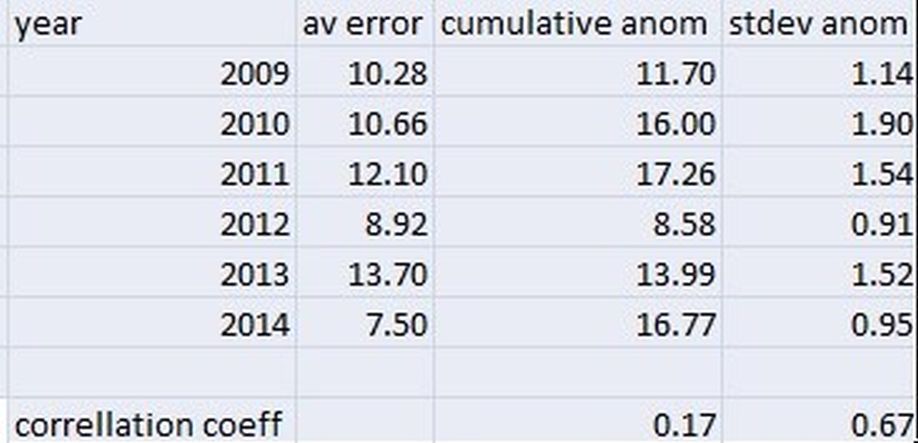
If you look at that way of doing it, you find a reasonable fit between the average error and the standard deviation of the anomaly - and much better than the fit between error and cumulative anomaly. The table below shows the correlation coefficient (how good a fit there is, 0=no fit and 1=perfect fit) between these two measures
Incidentally if 2010 is removed to get rid of the horrendous errors from Dec 2010 (CET anomaly of -5.8C vs 1971-2000) then the correlation coefficient of the STDEV goes up to 0.94
So as a rule of thumb, 2012 and 2014 have been quite easy years and 2010, 2011 and 2013 difficult based on Standard Deviation of anomaly and they have higher error rates