The Weather Outlook

Remove ads from site

KevBrads1
22 February 2014 05:56:49
Wettest winters on record for England and Wales

426.8 2013-14 up to 20th February

423.0 1914-15

Wettest seasons on record for England and Wales: W for winter, S for summer, A for autumn

A 502.7 2000

A 455.8 1852

A 438.6 1960

W 426.8 2013-14

Wettest February on record for England and Wales (mm)

158.6 1833

152.7 1923

143.6 1950

143.2 1990

143.2 1977

142.1 1937

132.0 1916

131.7 1900

130.0 1848

129.6 1966

129.1 1768

124.2 1925

123.5 1915

116.0 1918

115.3 1812

115.1 2002

114.9 1995

114.1 1851

114.0 1823

113.5 1776

112.1 1904

111.6 2007

109.1 1881

109. 2014 up to 20th February


MANCHESTER SUMMER INDEX for 2021: 238

Timelapses, old weather forecasts and natural phenomena videos can be seen on this site

http://www.youtube.com/channel/UCgrSD1BwFz2feWDTydhpEhQ/playlists

Hungry Tiger
22 February 2014 15:58:49

Wettest winters on record for England and Wales
426.8 2013-14 up to 20th February
423.0 1914-15

Wettest seasons on record for England and Wales: W for winter, S for summer, A for autumn
A 502.7 2000
A 455.8 1852
A 438.6 1960
W 426.8 2013-14

Wettest February on record for England and Wales (mm)
158.6 1833
152.7 1923
143.6 1950
143.2 1990
143.2 1977
142.1 1937
132.0 1916
131.7 1900
130.0 1848
129.6 1966
129.1 1768
124.2 1925
123.5 1915
116.0 1918
115.3 1812
115.1 2002
114.9 1995
114.1 1851
114.0 1823
113.5 1776
112.1 1904
111.6 2007
109.1 1881
109. 2014 up to 20th February

Originally Posted by: KevBrads1 

I wonder where we'll end up for totals - we've crossed the line OK still with 6 days to go.


Gavin S. FRmetS.

TWO Moderator.

Contact the TWO team - [email protected]

South Cambridgeshire. 93 metres or 302.25 feet ASL.


KevBrads1
23 February 2014 06:41:46
Wettest winters on record for England and Wales

427.8 2013-14 up to 21st February

423.0 1914-15

Wettest seasons on record for England and Wales: W for winter, S for summer, A for autumn

A 502.7 2000

A 455.8 1852

A 438.6 1960

W 427.8 2013-14

Wettest February on record for England and Wales (mm)

158.6 1833

152.7 1923

143.6 1950

143.2 1990

143.2 1977

142.1 1937

132.0 1916

131.7 1900

130.0 1848

129.6 1966

129.1 1768

124.2 1925

123.5 1915

116.0 1918

115.3 1812

115.1 2002

114.9 1995

114.1 1851

114.0 1823

113.5 1776

112.1 1904

111.6 2007

110. 2014 up to 21st February


MANCHESTER SUMMER INDEX for 2021: 238

Timelapses, old weather forecasts and natural phenomena videos can be seen on this site

http://www.youtube.com/channel/UCgrSD1BwFz2feWDTydhpEhQ/playlists

Col
  • Col
  • Advanced Member
23 February 2014 11:03:03

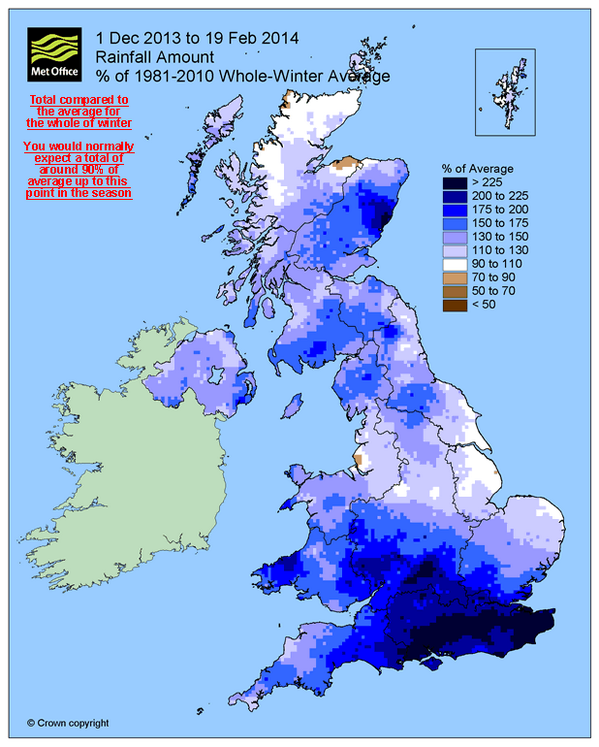
This has just been tweeted, it shows the really wet area is quite small and large areas (including here) have only been a bit wetter than average.
But because the wet area is in the SE we have heard nothing else for weeks.
Originally Posted by: Sevendust 


Sorry have to disagree with that slightly. There is a significant amount of England, Wales and Scotland that are in the blue shaded area for 130 to 150% of rainfall. I would guess in the next blue shaded area for 150 to 175% of rainfall you have just under half of England, Wales and Scotland. To me that is not just the SE and is noteworthy country wide! Certainly those in Somerset, Worcestershire, Aberystwyth, Cornwall etc. would have something to say about it being perceived as just the SE I would imagine.........

Interesting map and does show that some areas have been only slightly above average, as you point out, but also large swathes more than slightly above average and still 8 days to go!

BigGrin

Originally Posted by: Deep Powder 

As the SE has most of the population the original contention is always likely to be the case, but as DP has pointed out, its not just the SE that has suffered the effects of severe flooding

Originally Posted by: four 

Agreed. I don't think this is an example of London/SE centricity. Which area has been in the news for weeks and weeks now? The Somerset Levels, that's where and last time I checked that was nowhere near London.


Col

Bolton, Lancashire

160m asl

Snow videos:

http://www.youtube.com/channel/UC3QvmL4UWBmHFMKWiwYm_gg

Col
  • Col
  • Advanced Member
23 February 2014 11:08:43

UserPostedImage

Originally Posted by: doctormog 


What is striking is that area around the Moray Firth, Lossiemouth? is below average, yet look at that patch on the east coast between Aberdeen and Edinburgh and how wet that is.

That is very strange, not sure what happened there for that to happen for that area of Scotland to be so wet when you consider that this winter has been so Atlantic dominated.

Originally Posted by: Chiltern Blizzard 


Yes, it is an interesting point that Kevin. I wonder if the southerly tracking Lows which have brought in a lot of rain to parts of the south have dragged in lots of moisture on a SEly flow impacting the eastern parts of Scotland leaving the Moray Firth and Edinburgh more sheltered from the deluges. Sadly we have not been as lucky and E Scotland has also had its wettest winter on record.

Originally Posted by: doctormog 

Another observation that I find odd given the weather has been Atlantic dominated is the small brown blob over Liverpool...

Originally Posted by: KevBrads1 


That's just pollution Clown

Originally Posted by: four 

Haha, but joking aside it hasn't struck me as having been a particualrly wet winter up here. I don't take rainfall readings but my overall impression is only a little above average (as the map suggests). Much more significant has been the sheer relentlessness of unsettled conditions, rather than a particualrly high total. 


Col

Bolton, Lancashire

160m asl

Snow videos:

http://www.youtube.com/channel/UC3QvmL4UWBmHFMKWiwYm_gg

Hungry Tiger
23 February 2014 13:08:06

Wettest winters on record for England and Wales
427.8 2013-14 up to 21st February
423.0 1914-15

Wettest seasons on record for England and Wales: W for winter, S for summer, A for autumn
A 502.7 2000
A 455.8 1852
A 438.6 1960
W 427.8 2013-14

Wettest February on record for England and Wales (mm)
158.6 1833
152.7 1923
143.6 1950
143.2 1990
143.2 1977
142.1 1937
132.0 1916
131.7 1900
130.0 1848
129.6 1966
129.1 1768
124.2 1925
123.5 1915
116.0 1918
115.3 1812
115.1 2002
114.9 1995
114.1 1851
114.0 1823
113.5 1776
112.1 1904
111.6 2007
110. 2014 up to 21st February

Originally Posted by: KevBrads1 

It would be interesting if we managed another 20 mm for February. Can't see us getting any more than that. That would put us in the top 10 wettest Februaries on record.

I would guess 20mm is the most we might see this last 5 days.


Gavin S. FRmetS.

TWO Moderator.

Contact the TWO team - [email protected]

South Cambridgeshire. 93 metres or 302.25 feet ASL.


UncleAlbert
23 February 2014 13:40:51
The rainfall distribution over the South of the UK seems strange. My take on the general pattern is as follows:

We saw a procession of deep lows heading in towards Ireland. On their southern flank relatively low heights which were sourced from the freeze on the eastern seaboard were pulled in quickly by the vigourous circulations. At the same time the cold air was quickly being mixed out. Temperature differentials between SSTs and 850s were generally much greater than normal for a RPM airmass due to the speed of approach of the cold air and the low starting temperatures in America. This caused a lot of convection and minor troughing over the South of the UK. Also this tended to top up the troughs which often got stuck over the South East due to blocking to the east.

The problem is that with the convective factor you would expect there to be an orographic correlation. The west of Dartmoor appears drier than South East Devon for instance and the west of the Brecon beacons and Exmoor show similar oddities.

Any ideas anybody, I think I'm going back to the drawing board!

Essan
23 February 2014 15:13:01

Impressive figure from Hurn there, and not far from my home location, where the total to the end of today (assuming it remains dry for the next 22 minutes) is 560mm.

That's 260% of the average for the entire winter! 

Originally Posted by: Stormchaser 


That's nearly as much as we get here in a year!

Don't have an exact figure, but DJF rainfall so far for me is ~250mm - similar to July 2007.


Andy

Evesham, Worcs, Albion - 35m asl

Weather & Earth Science News 

Look in the doubt we've wallowed, look at the leaders we've followed, look at the lies we've swallowed, and I don't want to hear no more

Essan
23 February 2014 15:15:46

This has just been tweeted, it shows the really wet area is quite small and large areas (including here) have only been a bit wetter than average.
But because the wet area is in the SE we have heard nothing else for weeks.

Originally Posted by: Col 


Sorry have to disagree with that slightly. There is a significant amount of England, Wales and Scotland that are in the blue shaded area for 130 to 150% of rainfall. I would guess in the next blue shaded area for 150 to 175% of rainfall you have just under half of England, Wales and Scotland. To me that is not just the SE and is noteworthy country wide! Certainly those in Somerset, Worcestershire, Aberystwyth, Cornwall etc. would have something to say about it being perceived as just the SE I would imagine.........

Interesting map and does show that some areas have been only slightly above average, as you point out, but also large swathes more than slightly above average and still 8 days to go!

BigGrin

Originally Posted by: Sevendust 

As the SE has most of the population the original contention is always likely to be the case, but as DP has pointed out, its not just the SE that has suffered the effects of severe flooding

Originally Posted by: Deep Powder 

Agreed. I don't think this is an example of London/SE centricity. Which area has been in the news for weeks and weeks now? The Somerset Levels, that's where and last time I checked that was nowhere near London.

Originally Posted by: four 


Aye, Aberdeen is nowhere near London

I wonder why it's been so much wetter there than anywhere else in Scotland?   Especially since, in theory, it's in the rain shadow of the Highlands.


Andy

Evesham, Worcs, Albion - 35m asl

Weather & Earth Science News 

Look in the doubt we've wallowed, look at the leaders we've followed, look at the lies we've swallowed, and I don't want to hear no more

nouska
23 February 2014 15:28:36

Tight little circulations on a southern trajectory, through the Channel or northern France, giving a high incidence of SE flows into the Aberdeen coast. Would this also be the reason for the drier pattern to the west in the Devon area?

Edit - the areas with the big percentages are normally drier, being in prevailing rain shadow - change from that will show as much greater anomaly than areas that are normally wet in classic W/SW zonality.

doctormog
23 February 2014 15:57:42

This has just been tweeted, it shows the really wet area is quite small and large areas (including here) have only been a bit wetter than average.
But because the wet area is in the SE we have heard nothing else for weeks.

Originally Posted by: Essan 


Sorry have to disagree with that slightly. There is a significant amount of England, Wales and Scotland that are in the blue shaded area for 130 to 150% of rainfall. I would guess in the next blue shaded area for 150 to 175% of rainfall you have just under half of England, Wales and Scotland. To me that is not just the SE and is noteworthy country wide! Certainly those in Somerset, Worcestershire, Aberystwyth, Cornwall etc. would have something to say about it being perceived as just the SE I would imagine.........

Interesting map and does show that some areas have been only slightly above average, as you point out, but also large swathes more than slightly above average and still 8 days to go!

BigGrin

Originally Posted by: Col 

As the SE has most of the population the original contention is always likely to be the case, but as DP has pointed out, its not just the SE that has suffered the effects of severe flooding

Originally Posted by: Sevendust 

Agreed. I don't think this is an example of London/SE centricity. Which area has been in the news for weeks and weeks now? The Somerset Levels, that's where and last time I checked that was nowhere near London.

Originally Posted by: Deep Powder 


Aye, Aberdeen is nowhere near London

I wonder why it's been so much wetter there than anywhere else in Scotland?   Especially since, in theory, it's in the rain shadow of the Highlands.

Originally Posted by: four 

It's not in a rain shadow from the Highlands when the wind is coming in from the North Sea 😝


KevBrads1
24 February 2014 05:42:48
Wettest winters on record for England and Wales

428.8 2013-14 up to 21st February

423.0 1914-15

Wettest seasons on record for England and Wales: W for winter, S for summer, A for autumn

A 502.7 2000

A 455.8 1852

A 438.6 1960

W 428.8 2013-14

Wettest February on record for England and Wales (mm)

158.6 1833

152.7 1923

143.6 1950

143.2 1990

143.2 1977

142.1 1937

132.0 1916

131.7 1900

130.0 1848

129.6 1966

129.1 1768

124.2 1925

123.5 1915

116.0 1918

115.3 1812

115.1 2002

114.9 1995

114.1 1851

114.0 1823

113.5 1776

112.1 1904

111.6 2007

111. 2014 up to 22nd February


MANCHESTER SUMMER INDEX for 2021: 238

Timelapses, old weather forecasts and natural phenomena videos can be seen on this site

http://www.youtube.com/channel/UCgrSD1BwFz2feWDTydhpEhQ/playlists

KevBrads1
25 February 2014 06:30:42
Wettest winters on record for England and Wales

430.8 2013-14 up to 23rd February

423.0 1914-15

Wettest seasons on record for England and Wales: W for winter, S for summer, A for autumn

A 502.7 2000

A 455.8 1852

A 438.6 1960

W 430.8 2013-14

Wettest February on record for England and Wales (mm)

158.6 1833

152.7 1923

143.6 1950

143.2 1990

143.2 1977

142.1 1937

132.0 1916

131.7 1900

130.0 1848

129.6 1966

129.1 1768

124.2 1925

123.5 1915

116.0 1918

115.3 1812

115.1 2002

114.9 1995

114.1 1851

114.0 1823

113.5 1776

113. 2014. Up to 23rd February


MANCHESTER SUMMER INDEX for 2021: 238

Timelapses, old weather forecasts and natural phenomena videos can be seen on this site

http://www.youtube.com/channel/UCgrSD1BwFz2feWDTydhpEhQ/playlists

KevBrads1
25 February 2014 08:58:46
Here's a grim stat, the total from 12th December to now has exceeded the old record of 1914-15. 12th December is when it all started.

12th December to 11th March is going to be an interesting total, this is the same length of time as a meteorological winter except in leap years.


MANCHESTER SUMMER INDEX for 2021: 238

Timelapses, old weather forecasts and natural phenomena videos can be seen on this site

http://www.youtube.com/channel/UCgrSD1BwFz2feWDTydhpEhQ/playlists

Caz
  • Caz
  • Advanced Member
25 February 2014 22:29:03

As Duane posted earlier in the thread, although winter has been wet here, it hasn't been anything unusual and certainly not record breaking.  We've had floods in previous years, but not this year.


Market Warsop, North Nottinghamshire.

Join the fun and banter of the monthly CET competition.

Sevendust
26 February 2014 06:21:31

With 2 secondary lows possibly lining up to move across the south on Friday and Saturday the rainfall(even wet snow) will not be welcome once again.

Its been the wettest weather I've seen in my lifetime this winter

KevBrads1
26 February 2014 06:33:04
Wettest winters on record for England and Wales

434.8 2013-14 up to 24th February

423.0 1914-15

Wettest seasons on record for England and Wales: W for winter, S for summer, A for autumn

A 502.7 2000

A 455.8 1852

A 438.6 1960

W 434.8 2013-14

Wettest February on record for England and Wales (mm)

158.6 1833

152.7 1923

143.6 1950

143.2 1990

143.2 1977

142.1 1937

132.0 1916

131.7 1900

130.0 1848

129.6 1966

129.1 1768

124.2 1925

123.5 1915

117. 2014 up to 24th February


MANCHESTER SUMMER INDEX for 2021: 238

Timelapses, old weather forecasts and natural phenomena videos can be seen on this site

http://www.youtube.com/channel/UCgrSD1BwFz2feWDTydhpEhQ/playlists

KevBrads1
27 February 2014 05:53:57
Wettest winters on record for England and Wales

436.8 2013-14 up to 25th February

423.0 1914-15

Wettest seasons on record for England and Wales: W for winter, S for summer, A for autumn

A 502.7 2000

A 455.8 1852

A 438.6 1960

W 436.8 2013-14

Wettest February on record for England and Wales (mm)

158.6 1833

152.7 1923

143.6 1950

143.2 1990

143.2 1977

142.1 1937

132.0 1916

131.7 1900

130.0 1848

129.6 1966

129.1 1768

124.2 1925

123.5 1915

119. 2014 up to 25th February


MANCHESTER SUMMER INDEX for 2021: 238

Timelapses, old weather forecasts and natural phenomena videos can be seen on this site

http://www.youtube.com/channel/UCgrSD1BwFz2feWDTydhpEhQ/playlists

David M Porter
27 February 2014 09:43:03

With 2 secondary lows possibly lining up to move across the south on Friday and Saturday the rainfall(even wet snow) will not be welcome once again.

Its been the wettest weather I've seen in my lifetime this winter

Originally Posted by: Sevendust 

It's been the worst winter I can recall for incessant unsettled, wet weather. Many recent winters I can remember which have been dominated by unsettled weather from the atlantic have at least had a couple of lulls in that pattern from time to time. This winter though, just endless rain.

In some ways it's been like the dreadful weather of 2012 revisited.


Lenzie, Glasgow

"A body of men holding themselves accountable to nobody ought not to be trusted by anybody." – Thomas Paine

Hungry Tiger
27 February 2014 14:26:25

Amazing this winter has turned out to be.

So this February is now in top 15 for wetness.


Gavin S. FRmetS.

TWO Moderator.

Contact the TWO team - [email protected]

South Cambridgeshire. 93 metres or 302.25 feet ASL.


four
  • four
  • Advanced Member
27 February 2014 14:32:46

It's the distribution which is different.
Basically the south has had rain which would be a fairly normal winter in NW Scotland 

Here has been not that much above average with first half of December and second half of Feb not really wet at all - but between that made up for it.
2013 was about 200mm down on the average but we have caught up now.


Saint Snow
27 February 2014 15:06:26

It's the distribution which is different.

Originally Posted by: four 


Exactly - a point I've made several times so far this year. Much of the southern half of NW England at least has had no more than average rainfall


Martin

Home: St Helens (26m asl) Work: Manchester (75m asl)

A TWO addict since 14/12/01

"How can wealth persuade poverty to use its political freedom to keep wealth in power? Here lies the whole art of Conservative politics."

Aneurin Bevan

speckledjim
27 February 2014 15:39:57
We have had less than average over the whole winter, it's the wind that has been the main feature for me this winter
Thorner, West Yorkshire


Journalism is organised gossip

KevBrads1
27 February 2014 17:14:45
You are going to find that records at the national especially when it comes to high levels of precipitation are never uniform.

I posted a map of the wettest month on record for England and Wales, October 1903 but for east Anglia, August 1912 was wetter than this.

It should come as no surprise you are going to get regional variations. It's the fact that despite the regional variations, the record was broken.

You are going to find that with many if not all rainfall records when it comes to wetness.


MANCHESTER SUMMER INDEX for 2021: 238

Timelapses, old weather forecasts and natural phenomena videos can be seen on this site

http://www.youtube.com/channel/UCgrSD1BwFz2feWDTydhpEhQ/playlists

KevBrads1
28 February 2014 06:26:06
Wettest winters on record for England and Wales

443.8 2013-14 up to 26th February

423.0 1914-15

Wettest seasons on record for England and Wales: W for winter, S for summer, A for autumn

A 502.7 2000

A 455.8 1852

W 443.8 2013-14

Wettest February on record for England and Wales (mm)

158.6 1833

152.7 1923

143.6 1950

143.2 1990

143.2 1977

142.1 1937

132.0 1916

131.7 1900

130.0 1848

129.6 1966

129.1 1768

126. Up to 26th February


MANCHESTER SUMMER INDEX for 2021: 238

Timelapses, old weather forecasts and natural phenomena videos can be seen on this site

http://www.youtube.com/channel/UCgrSD1BwFz2feWDTydhpEhQ/playlists

Remove ads from site