I thought I'd start a new thread and see how it goes. "Snow chance" is where you can post cherry picked charts during the winter period. It's not intended to be scientific, and the charts can be from any model, deterministic or ensemble. Usually, the charts show winter promise that never materialises or is watered down (no pun intended). If this thread keeps going through the winter months we could end up with a scrapbook in April of the "winter that could have been" rather than the winter that was. If it doesn't that's fine too!
I'll post static images so they won't update.
I'll try and simplify the process, but currently to generate statics on TWO: 1) Click copy image in the header 2) Paste the image (don't confuse with page url, correct url will end .png) url 3) Press copy 4) Copy the image url generated and paste in.
If linking to external sites try and make sure the urls won't refresh
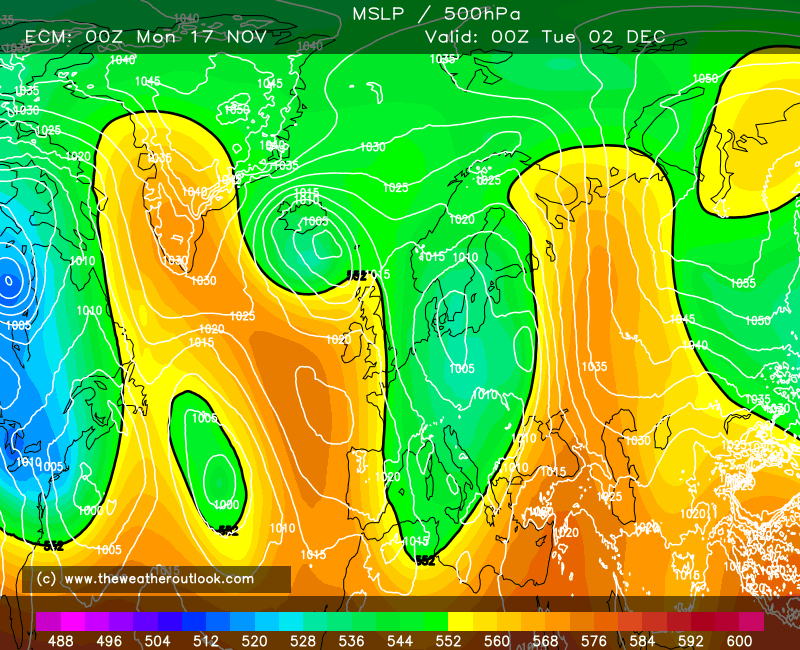
I'll kick off today with this chart from the ECM 00Z deterministic. The 850s aren't low and rain is moving down fro mthe northwest, but I like the look of it!
Edited by user
17 November 2025 15:41:55
|
Reason: Not specified