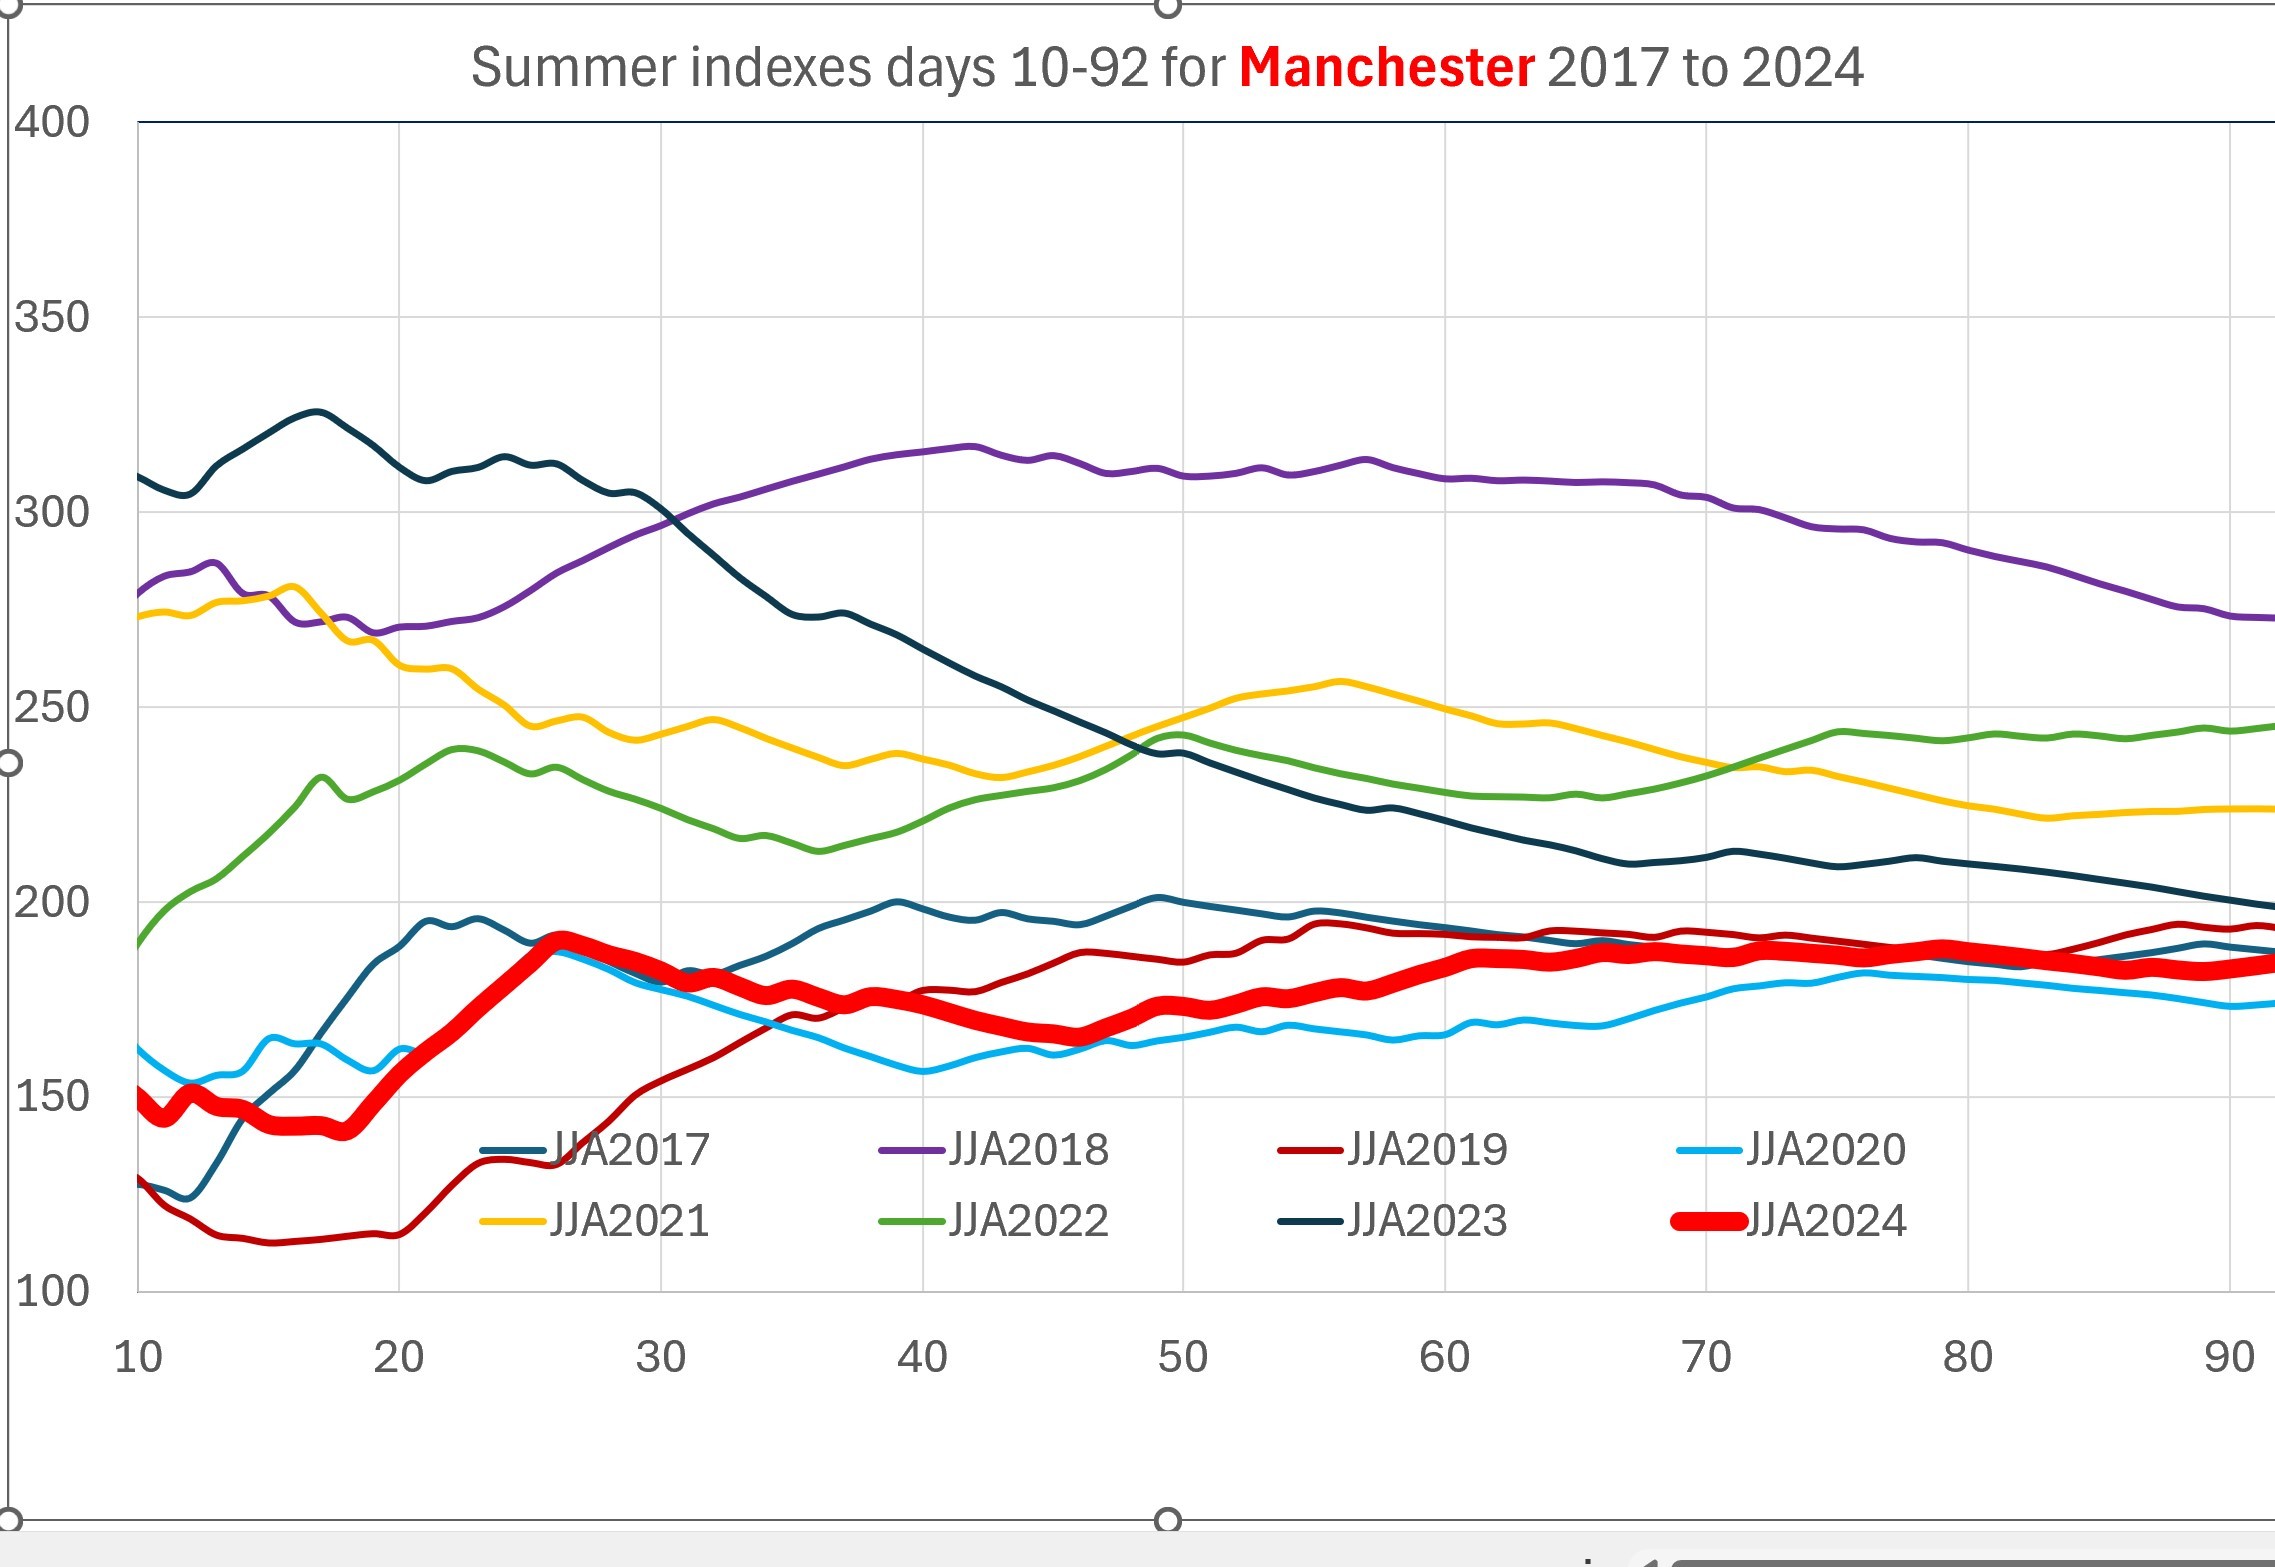
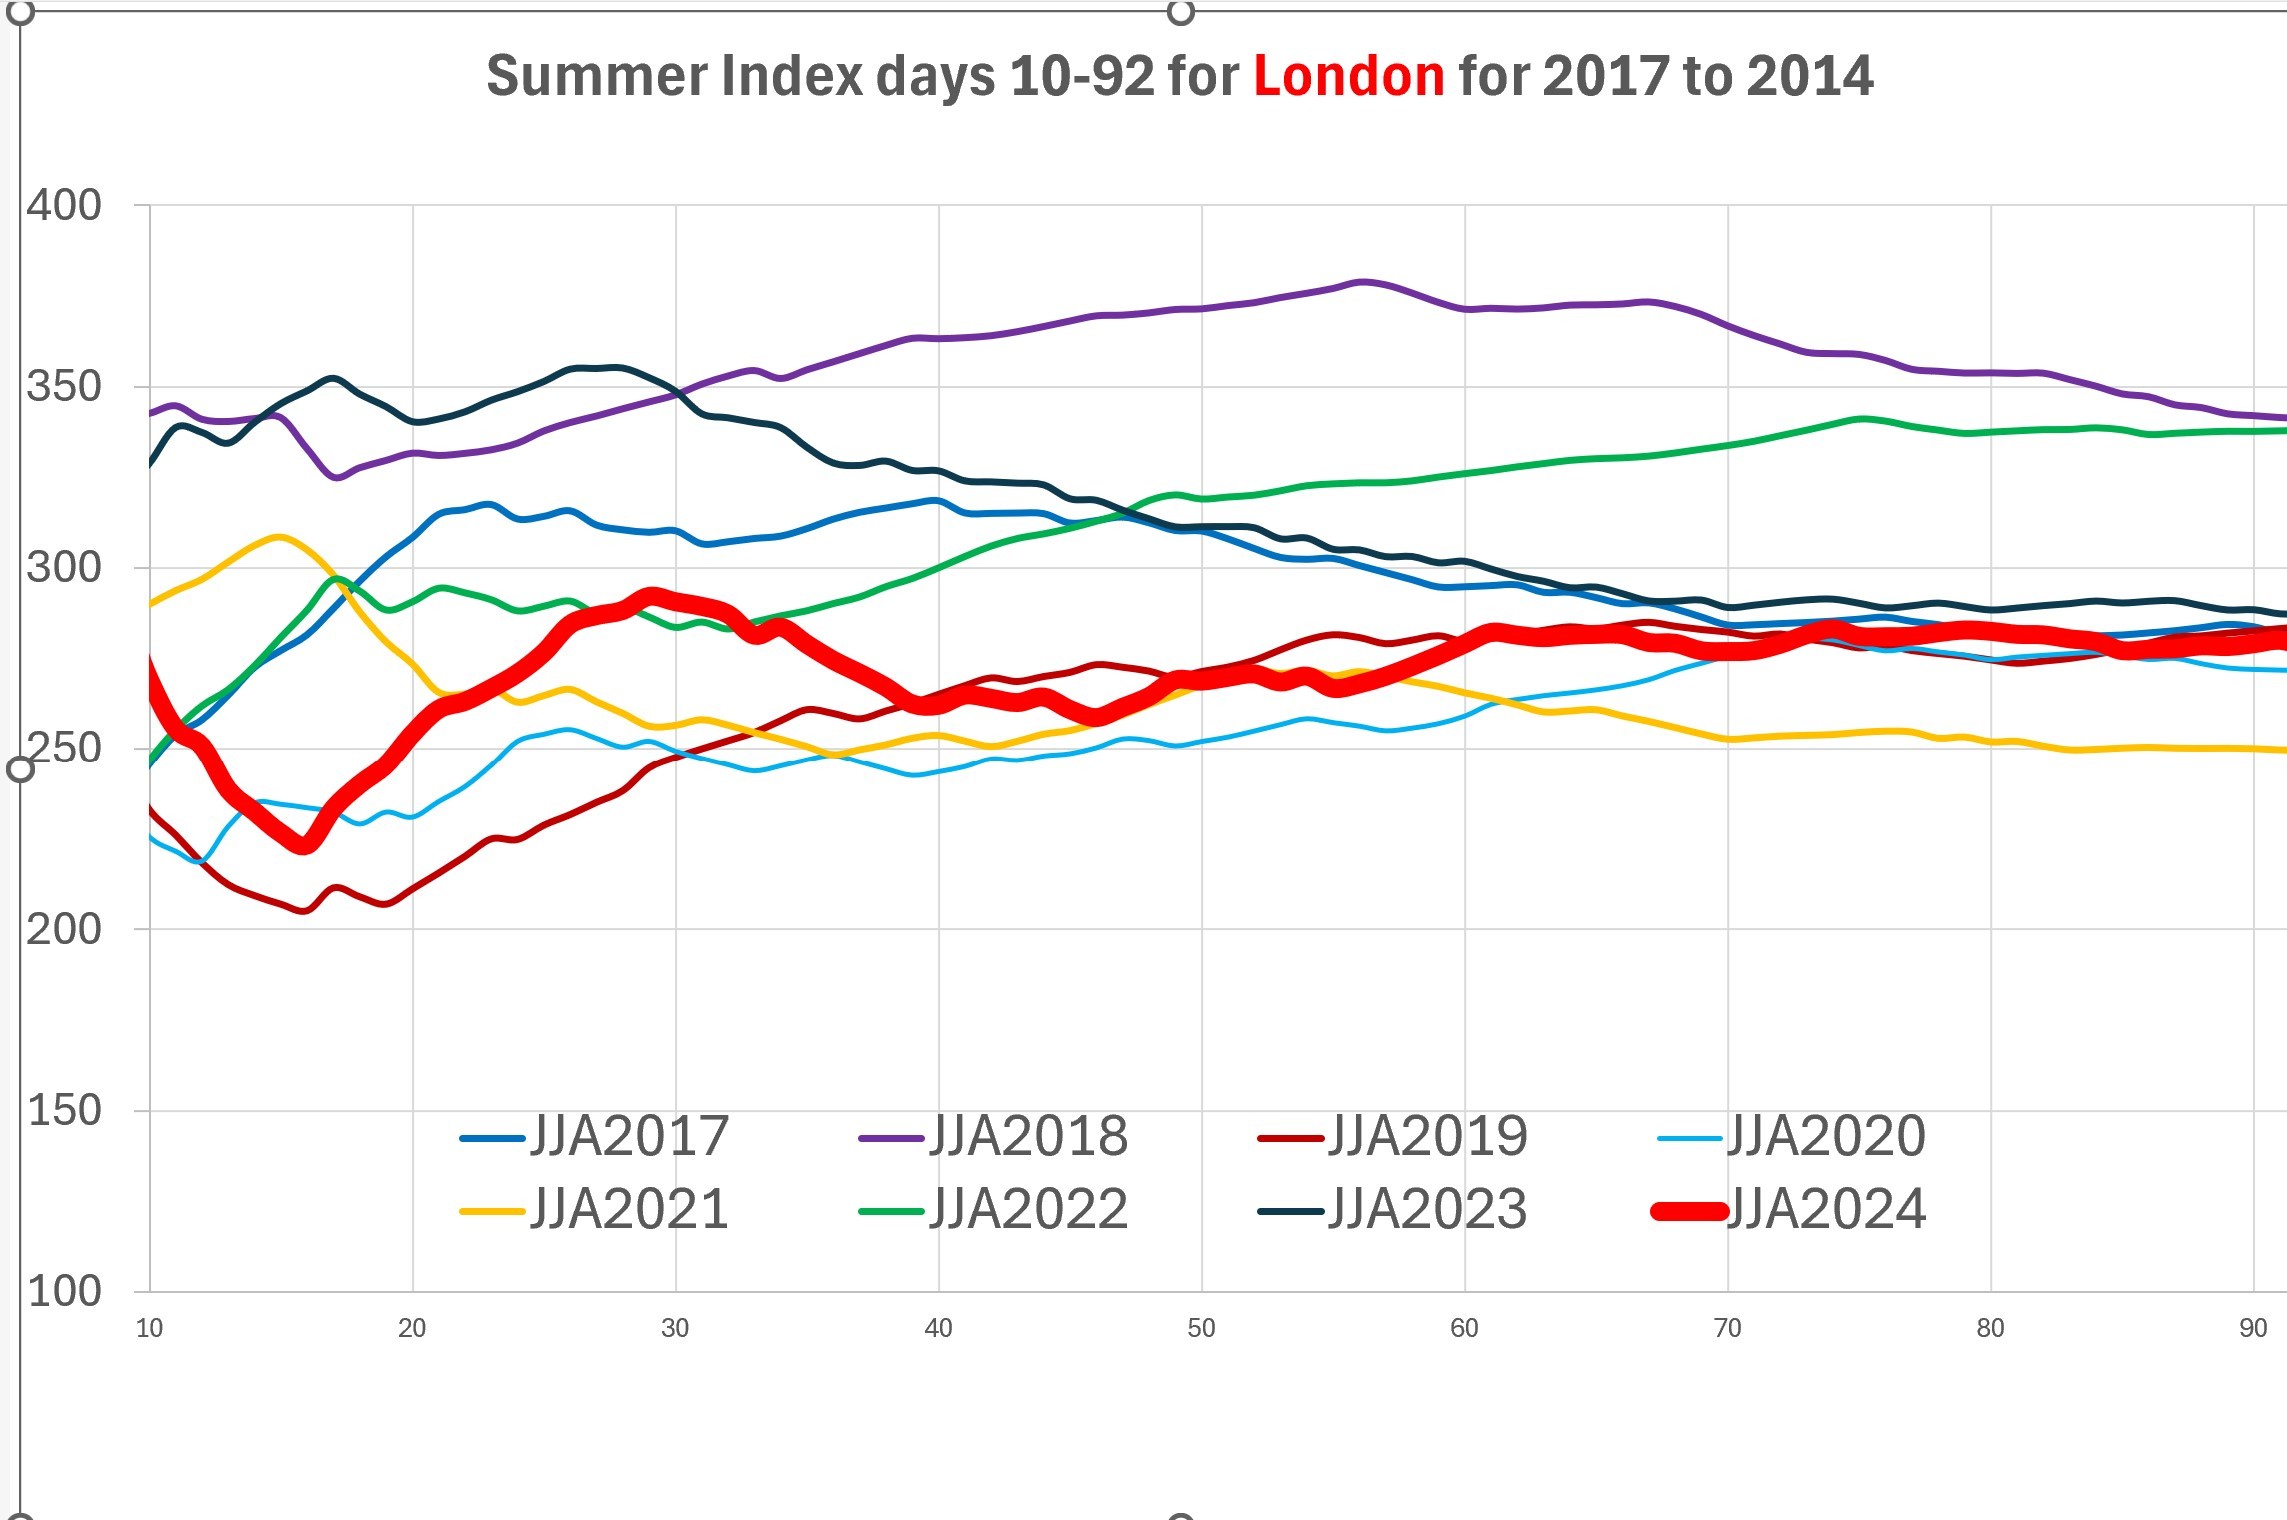
I have used Kevin Bradshaw’s “Manchester Summer Index” formula to plot the summer indexes for 2024 and the previous 7 years 2017-2023 for both NW and SE England
This index combines Maximum Temperature, Sun Hours and Rain Days into an index value ranging from about 150-350 for the whole or part of a summer
There was a fair bit if debate this year about how different the summer felt between the north and south of the UK and this is borne out by the two graphs.
The NW England graph show that 2024 was almost bottom of the 2017-2024 summers for that area in terms of the index value whereas in the SE it was a fairly average summer being around the middle of the pack
The SE index is on average higher by about 75 due to average maxima being 3-4C higher (40% contribution) less rain days (40%) and more sun hours (20%) but this year the difference was about 95 in favour of the SE
Originally Posted by: lanky