Who remembers when Kevin Bradshaw (aka Mr Data) used to publish his Manchester Summer Index every week or so to measure how this summer was progressing compared to summers of bygone days.
He used an algorithm based on cumulative Sun Hours, Average Maximum Temperature and Cumulative rain days (>= 0.2 mm IIRC) for his local readings oin Manchester
With his permission I hijacked this a few years ago to do my own version for my area in SW London which generally came out significantly higher than his nearly every year due to lower rainfall and higher temperatures down here on average
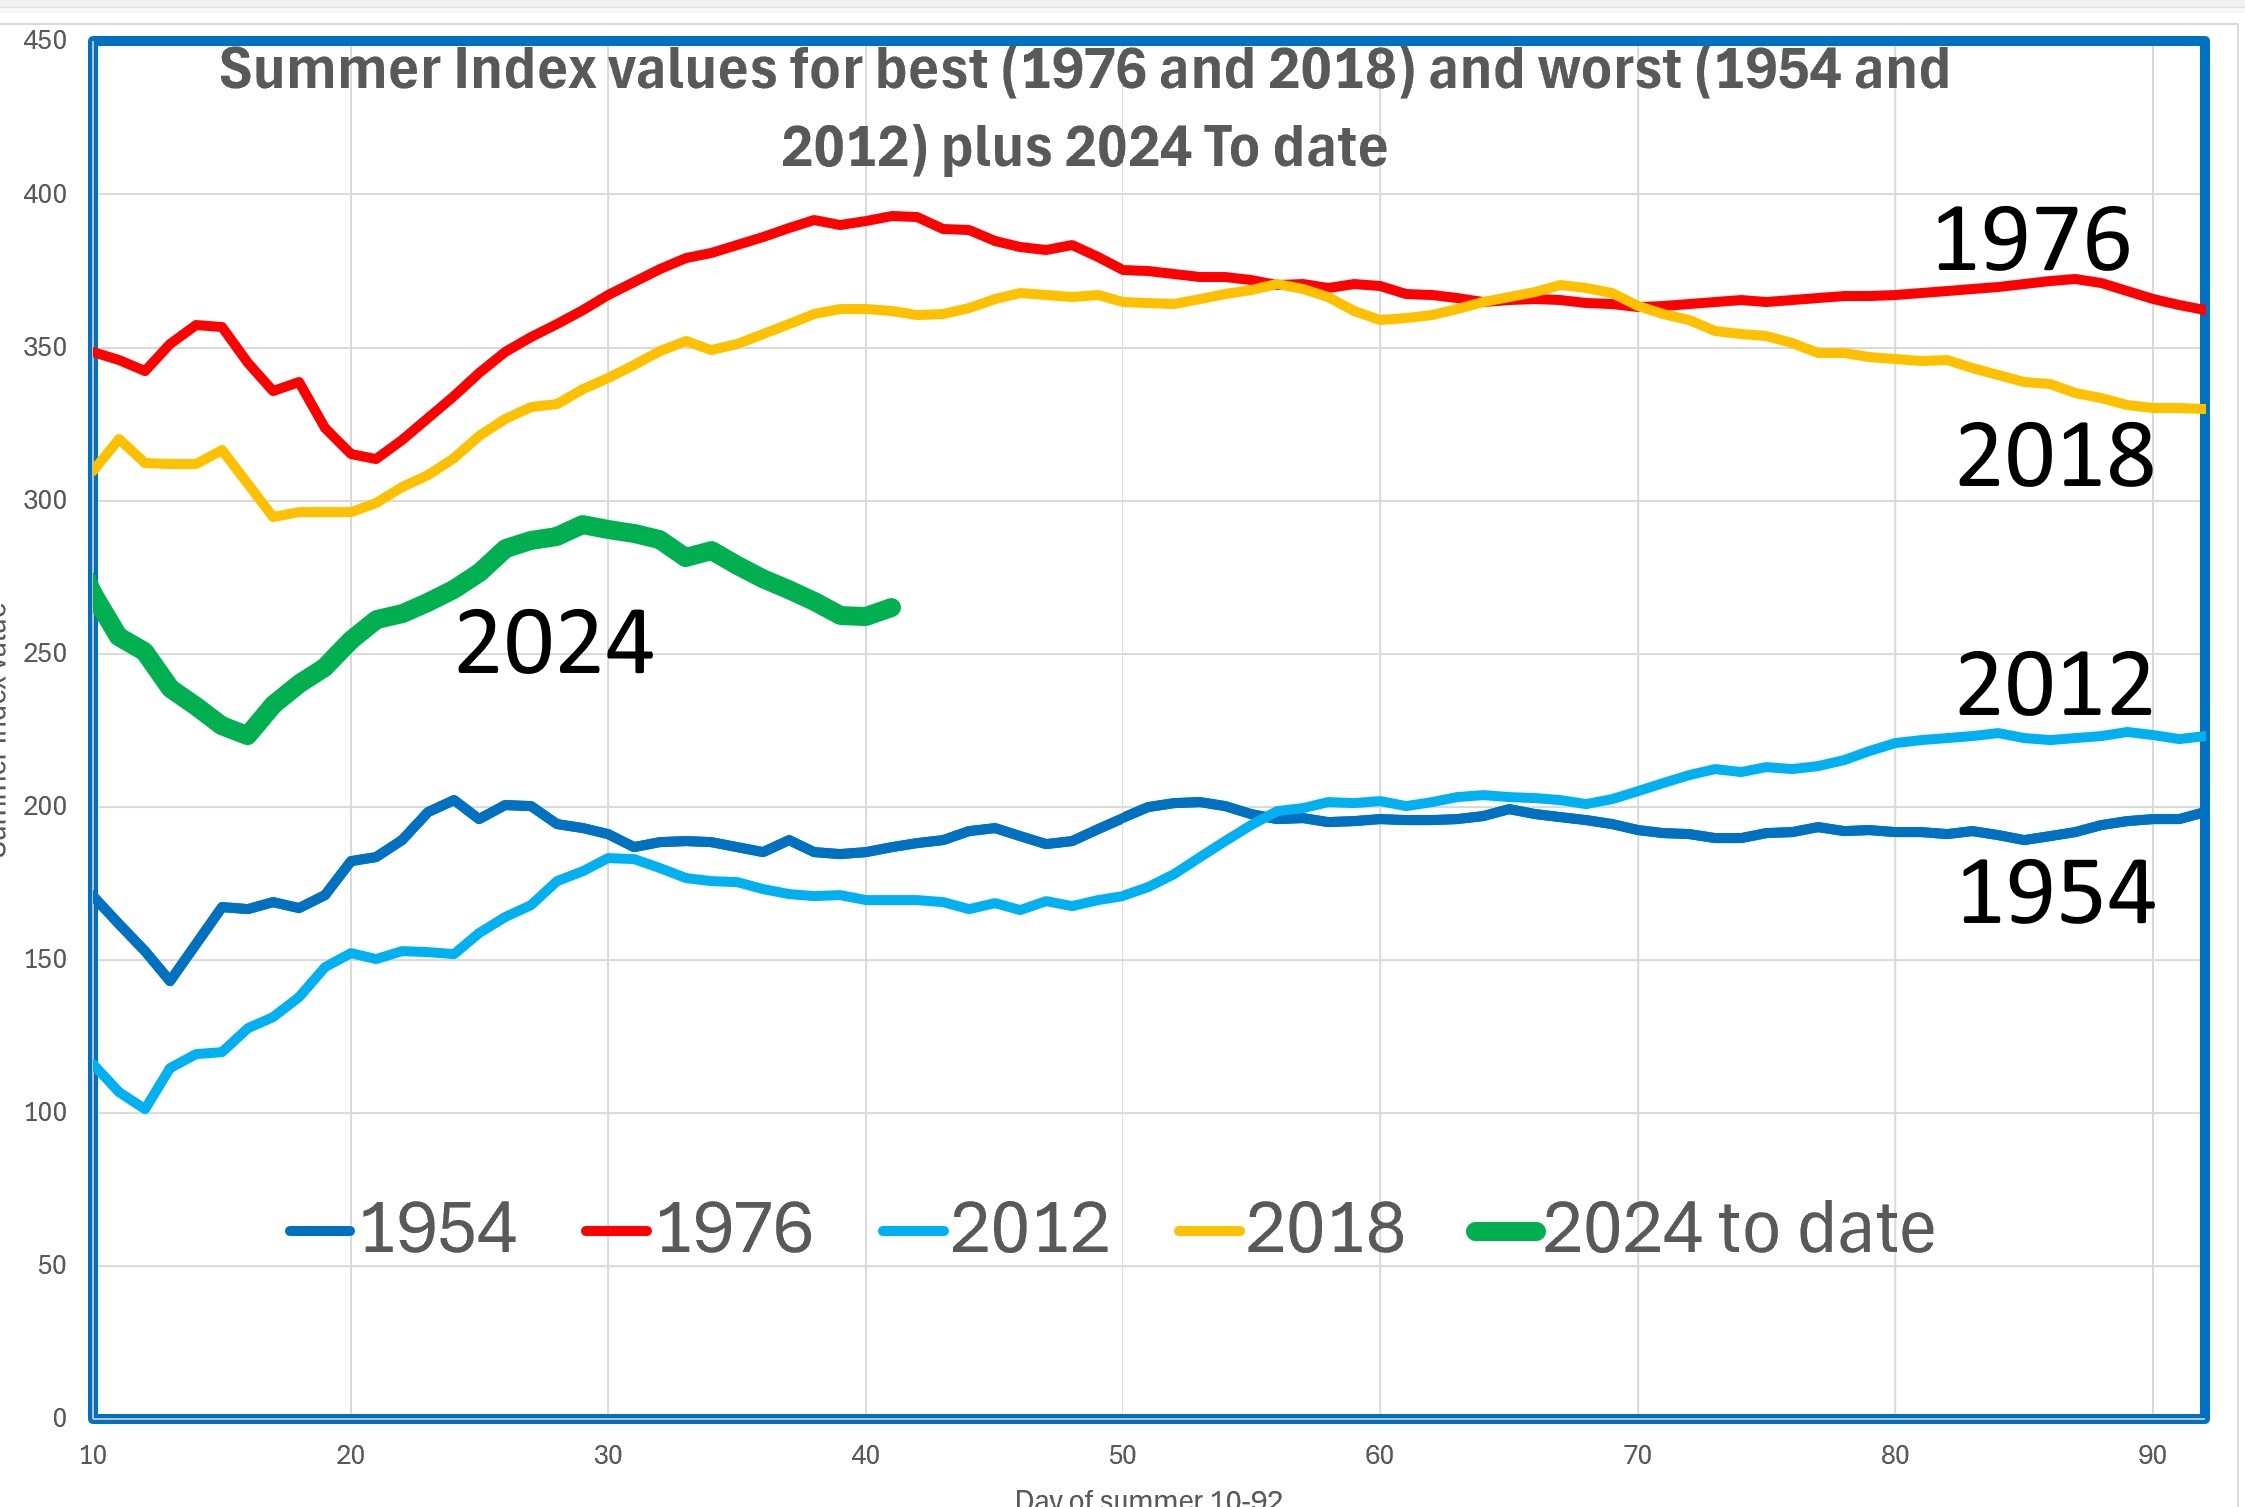
As there are so many complaints about this year's summer I thought it might be worth having another go at it. This one shoes this years data by f=day number of the summer (1-92) starting at day 10 for the best and worst or=f recent summers 2012 and 2018 and the best and worst for the last 125 years (1954 and 1976) plus 2024 so far
This year is just about bang in the middle of these and way better than 2012 to which some comparisons hav ebeen made
The graph is below and right click + open in new tab to see it fuller sized
Originally Posted by: lanky