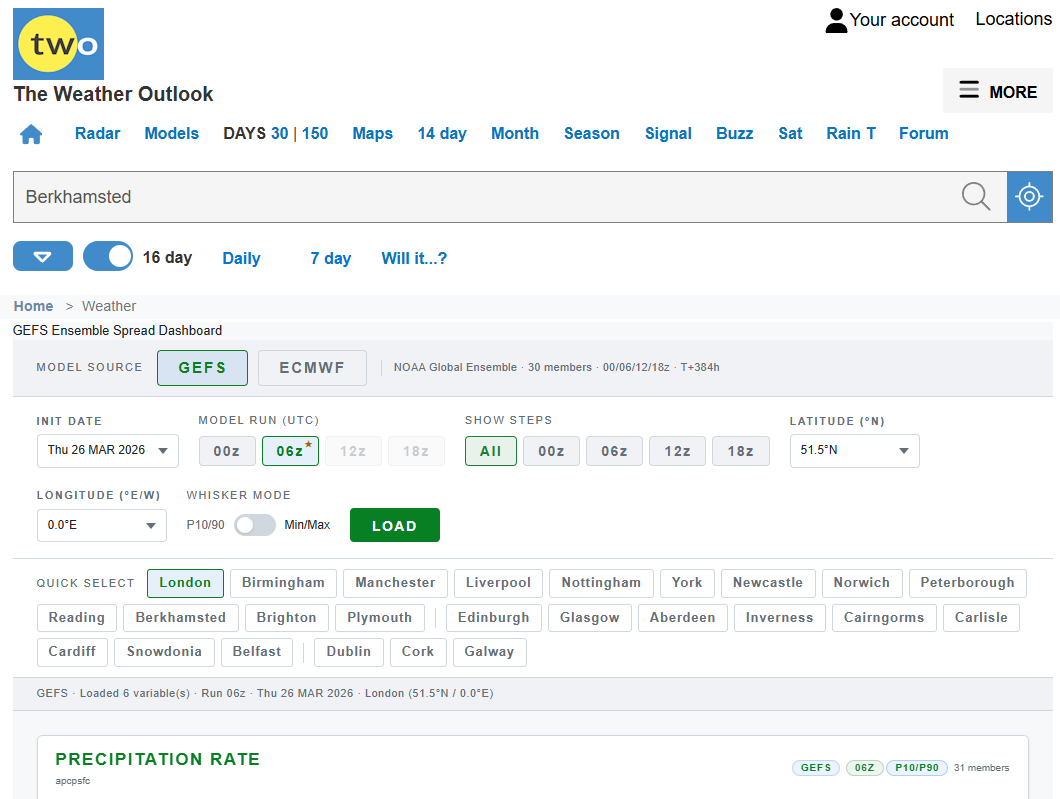
I’ve just added a new feature that lets you explore ensemble forecast spread for the UK and Ireland using interactive box and whisker charts.
It brings together data from the NOAA GEFS and ECMWF IFS ensemble models, showing how forecasts vary across all members (30 for GEFS and 51 for IFS). You can view probabilistic forecasts for temperature, precipitation, wind, and more, for locations across the UK and Ireland, out to 16 days ahead.
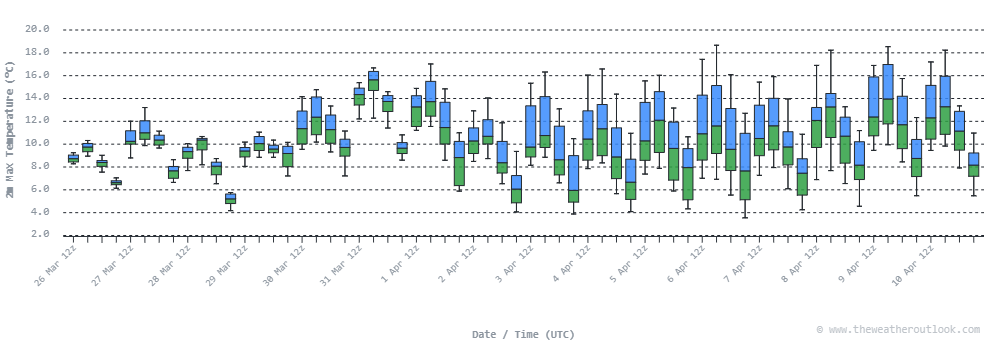
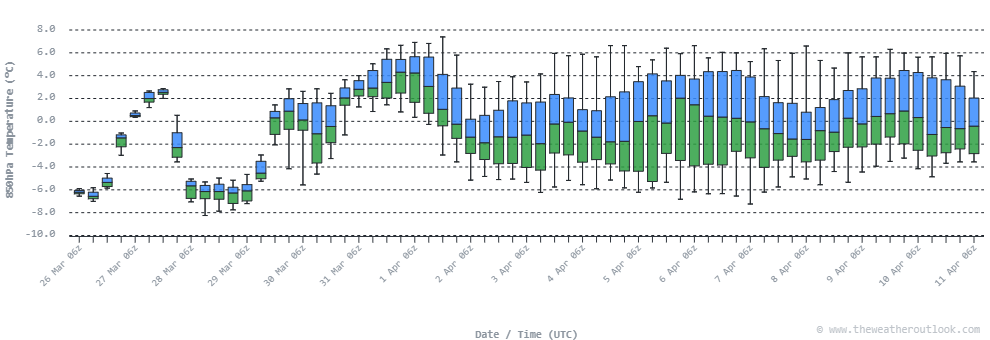
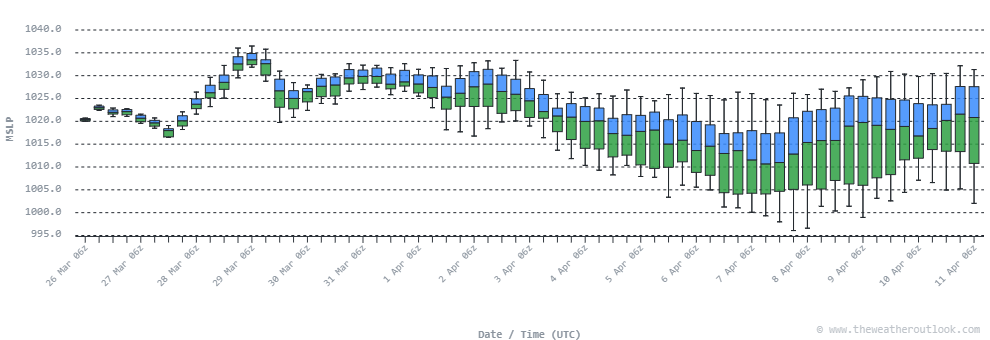
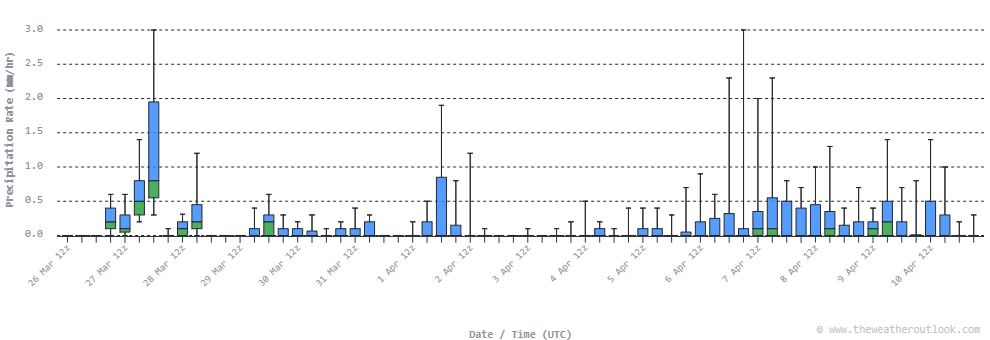
Each chart represents a single weather variable. The box shows the interquartile range (25th to 75th percentile), while the whiskers extend to either the 10th/90th percentiles or the full min/max range — depending on the selected Whisker Mode. The median is shown as a line through the centre of the box, making it easy to see the “middle ground” of the ensemble.
You can use the Show Steps filter to focus on a specific time of day throughout the forecast period. For example, selecting 12z will display only the midday values for each day, which helps when comparing trends from one day to the next.
The Quick Select buttons let you jump straight to a named location, or you can choose a specific grid point using the latitude and longitude dropdowns for more precise control.
Charts update automatically when switching between model sources, runs, or whisker modes, so there’s no need to reload the page.
Please note: Full functionality including location selection, historical runs, and access to ECMWF data — requires a Premium membership. Log in or upgrade your account to unlock all features.
Generated png example files below. The link is:
https://www.theweatheroutlook.com/twodata/ens-cs.aspx
PS: This has now been extended to include ECMWF AIFS ENS and MOGREPS-G. They're colour coded and labelled to make it easier to differentiate the plots.
Edited by user
01 April 2026 14:26:15
|
Reason: Not specified