Yes, more synoptic eye-candy but Im afraid even that chart flatters to deceive.
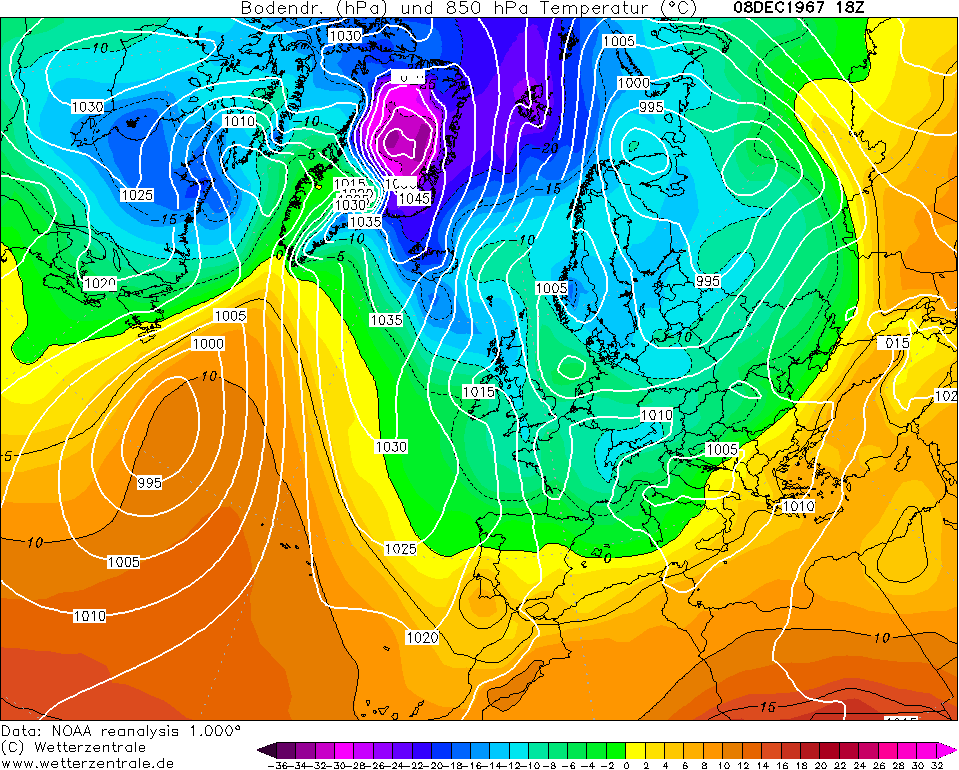
I am again left with the impression that northerlies are relatively impotent, and notably less severe than they were in past decades, particularly the latter decades of the twentieth century. I would be very interested to see what others think about this apparant reality. In the spirit of exploring this idea, I attach an image (and a link) of a typical northerly synoptic set up from early December 1967 - 10 uppers in fact made it into Normandy, with -15c approaching the north of Scotland. There was a notable snowstorm in Brighton:
http://www.wetterzentrale.de/reanalysis.php?uur=1800&var=2&nmaps=24&map=1&model=noaa&jaar=1967&maand=12&dag=08
A broadly similar synoptic picture to the early December 2017 scenario as depicted by the ECM this morning, almost 50 years later to the day:
http://old.wetterzentrale.de/topkarten/fsecmeur.html

Yes, I realise there are differences and no two synoptic situations are identical. However, a not dissimilar outbreak of Arctic Air 50 years later and the -10 isotherm runs out at The Faroe Islands and the -5 isotherm gets tethered by the time it reaches the south coast.
It seems to me that the loss of ice in The Arctic and the melting of the Greenland Ice sheet are combining with positive SST anomalies and a warmer atmosphere (paricularly in high latitides) to make northerlies a much reduced force in the British Winter. This is a pity, as they have been my favourite air mass (true Arctic Air) with its clairity and convection, and in the past, attendant chance of southern snow.
I realise that the two charts are different as the Greenalnd high is stronger in 1967 and the 2017 forecast is more of a mid Atlantic omega with a northern extension, but the differences in the reservoir of deep cold for us to tap into, are much reduced, sadly, in my opinion.
I am happy to have someone more knowledgeable than myself deconstruct my supposition, as it would be great see a similar Arctic outbreak as December 1967 brought us. Similarly, I would apprecaite some considered input from anyone knowledgeable who agrees. Im not wanting to turn the MO thread into the climate forum! But I am irritated at the current northerlies not being what they used to be. "The north wind doth blow and we shall have snow" could be replaced with "... and we shall have wintriness at high levels in the north".
Doesn't the bolded paragraph answer your question though? The two charts are indeed different. The purples in 1967 were concentrated entirely in northern Greenland, in the perfect spot for those synoptics to send them flowing on a narrow lane south through the British Isles; the 2017 chart, by contrast, shows the purple cold still present - it's just that it's all over the other side of the Pole from us.
In other words, the "reservoir of deep cold" to which you refer looks no different to me in terms of volume on those two charts, but entirely different in terms of position.
If you can find a historical chart which brings the -10 isotherm into Normandy on the basis of a northerly where there's a concentration of purples over the other side of the Pole similar to the 2017 chart, then in that case I'd agree, something must have changed. I just don't think the current set-up is a fair comparison.
2 miles west of Taunton, 32 m asl, where "milder air moving in from the west" becomes SNOWMAGEDDON.
Well, two or three times a decade it does, anyway.