I was intrigued as to whether the exceptionally mild December could have beaten in terms of the anomaly if any 30 day period was included rather than just the days spanning a calendar month.
In order to find out the daily CET records are required to be analysed rather than the monthly averages.
Fortunately daily CET means exist from 1772 up to the current day and so a sample of 244 years (about 89000 days) is available for analysis rather than the 357 years of monthly data
It turns out that December 2015 was SO exceptional that no 30 period chosen can beat the monthly recods set last week
My list of results is shown below for both hot and cold records covering every 30 day period on the file
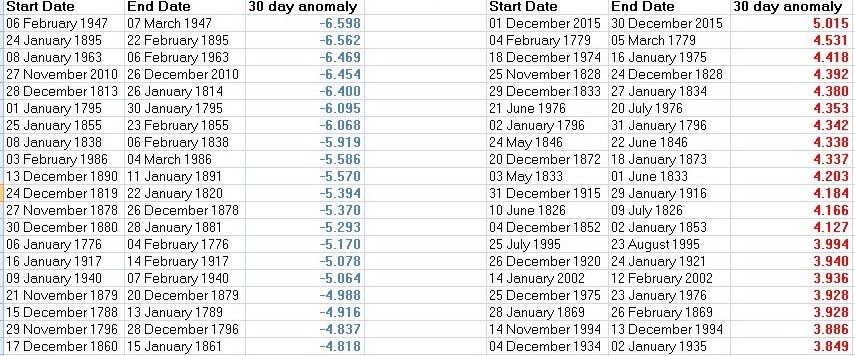
The cold records are far more extreme than the hot records mostly reflecting the occasional very severe winters we get with a blocking northern high
(for those interested the daily CET data was "detrended" by gradually increasing the temperature of older data to reflect the overall gradual warming in the last 250 years. This detrending totalled just under 1C applied across the whole data incrementally. Anomalies were calculated based on the average temperature for that day in the year)
I also had a go at calculating the "return period" for such an exceptional month using statistical analysis. Because the data is highly skewed towards colder temperatures at the extreme ends it is not easy. To get a 30 day anomaly that fits exactly into 1 calendar month is itself a 1 in 30 chance and to allow for this and the relative rarity of extreme warm periods I got a return period of 1850 years - although I'm not convinced about this